價格:免費
更新日期:2019-05-25
檔案大小:41.2 MB
目前版本:1.1
版本需求:需要 iOS 8.0 或以上版本。與 iPhone 5s、iPhone 6、iPhone 6 Plus、iPhone 6s、iPhone 6s Plus、iPhone SE、iPhone 7、iPhone 7 Plus、iPhone 8、iPhone 8 Plus、iPhone X、iPhone XS、iPhone XS Max、iPhone XR、iPad Air、iPad Air Wi-Fi + Cellular、iPad mini 2、iPad mini 2 Wi-Fi + Cellular、iPad Air 2、iPad Air 2 Wi-Fi + Cellular、iPad mini 3、iPad mini 3 Wi-Fi + Cellular、iPad mini 4、iPad mini 4 Wi-Fi + Cellular、12.9 吋 iPad Pro、12.9 吋 iPad Pro Wi-Fi + Cellular、iPad Pro(9.7 吋)、iPad Pro(9.7 吋)Wi-Fi + 行動網路、iPad (第 5 代)、iPad(第五代)Wi-Fi + 行動網路、iPad Pro(12.9 吋)(第二代)、iPad Pro(12.9 吋)(第二代)Wi-Fi + 行動網路、iPad Pro(10.5 吋)、iPad Pro(10.5 吋)Wi-Fi + 行動網路、iPad (第六代)、iPad Wi-Fi + Cellular(第六代)、iPad Pro(11 吋)、iPad Pro(11 吋) Wi-Fi + 行動網路、iPad Pro(12.9 吋)、iPad Pro(12.9 吋)Wi-Fi + 行動網路、iPad mini(第 5 代)、 iPad mini(第 5 代)Wi-Fi + 行動網路、 iPad Air(第 3 代)、 iPad Air(第 3 代)Wi-Fi + 行動網路、iPod touch (第 6 代) 及 iPod touch (第 7 代) 相容。

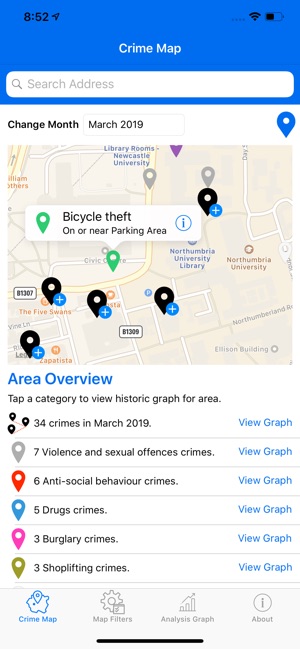
View the crimes around a particular area in England & Wales and generate graphs to determine how the crime rate has changed over time.

Compare multiple years at the same time, change the graph type and drill down further into a certain month to view a comparison by category of crime.

What can you do?

1) View crimes across an area by manually moving the map.

2) Track your location on the map to view the crimes in your current area.

3) Search for a particular location / area on the map.

4) Compare rates of crime based on the category of crime.

5) Choose a month and year to view crimes for on the map.

6) Focus on crime categories of your choice on the map by hiding certain categories.
7) Generate a historical graph for a particular year and category analysis graphs for a particular month.
8) Customise the graph, change the graph type and add additional years to compare.
支援平台:iPhone, iPad
